-
首頁
-
new訂閱制數位訂閱制 Ivy Engrest 介紹 數位訂閱制 Ivy Engrest 新手攻略new數位訂閱制 優惠方案 註冊享免費體驗 7 天,再送 $200
-
看文章登入註冊難度 收藏文章
請寫一篇英文作文, 文長至少 120 個單詞(words)。 文分兩段
>> 限量較誘人,還是打折更實在?Limited Edition or Big Discount?
圖表寫作
提示
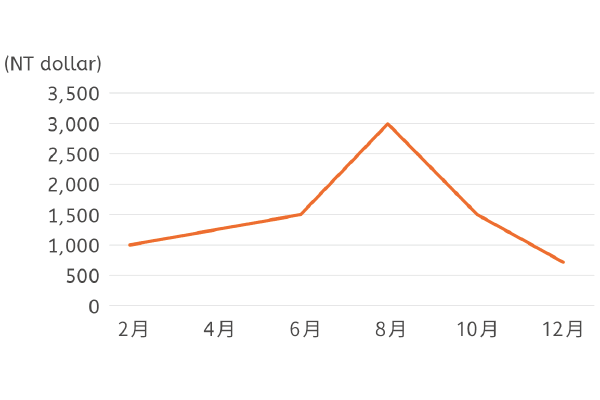
右圖呈現的是某戶人家去年一整年的家 用電費變化狀況。 請寫一篇英文作文, 文 長至少 120 個單詞( words)。 文分兩段, 第一段描述該圖表中的數據如何變化、 所 呈現的特別現象, 以及造成此種現象的可 能原因。 第二段提出這戶人家可以節約用 電以節省電費的具體作法。
寫作指導
圖表寫作旨在分析圖表數據,從數據中擷取重要的資訊,並分析資訊背後代表的意義。寫作時,須注意以下幾 點:
1. 分析圖表: 折線圖主要用以呈現整體走向,因此在分析折線圖時,須特別注意最大值、最小值與趨勢、急增、下跌等變化。
2. 描述重要變化: 進行圖表寫作時,不須鉅細靡遺地提出數據資料,而是將資料加以分析,僅描寫重大的差異變化,例如:急遽上 升、平穩增加、快速下降等等。
3. 說明代表意涵並提出合理解釋: 簡述圖表中的重要資訊後,說明這些變化所代表的現象,並提出可能造成這個現象的原因。
大綱
Paragraph 1
Point out the main features in the chart.
- (a) Between February and June, the monthly electric bill for this household rose steadily.
- (b) The bill soared to a peak in August before plunging sharply in October.
- (c) Over the final two months, the electric bill continued to decline.
Provide an explanation for the trend.
This probably resulted from the extended use of air conditioning in the summertime to cool down the house.
Paragraph 2
Give some tips to save on your electricity bill.
(a) Normally
- Switch off the lights when
leaving a room.
- Use energy-efficient appliances.
>> 大海東去,浪淘盡,漂浮飯店成幻影The Hotel That Lived on the Reef
單字片語整理
Words in Use
●n. 家庭(= family)a. 家用的;家庭的;家喻戶曉的,為許多人所知的A growing number of households have access to the internet.
越來越多的家庭都能上網。Juice blenders and coffee makers are examples of household appliances.
果汁機和咖啡機都是家電用品的範例。The famous singer is a household name all over the world.
這位著名歌手在全世界都是家喻戶曉的人物。多益藍色英檢中級高中 Level 4●●n. 山頂;最高點vi. 達到頂峰,達到最 大值a. 高峰的The young man climbed to the peak of the mountain in record time.
這位年輕人以破紀錄的時間攀上山峰。Sam’s business was at its peak when he was in his mid-40s.
山姆在 45 歲左右時事業到達顛峰。Traffic in Taipei reaches its peak at about 8 a.m.
臺北的交通大約在早上 8 點達到巔峰。The temperature in this area may peak at thirty seven degrees Celsius tomorrow.
明天這地區的溫度可能會達到攝氏 37 度。December is one of the peak periods for our business.
十二月是我們業務的高峰期之一。多益綠色英檢中級高中 Level 2●n. & vi. 下跌vt. & vt. 婉拒n. 下降=decreaseBob declined to join Judy's dinner party.
鮑伯婉拒出席茱蒂的晚宴派對。I offered to give Tina a ride after the party, but she declined.
舞會結束後我提議讓蒂娜搭便車,但她婉拒了。Car sales declined by 5% in the second quarter.
汽車銷售量在第 2 季下降了 5%。Street violence seems to have been on the decline ever since the new mayor was sworn in.
新市長上任後,街頭暴力事件似乎已在減少中。多益藍色英檢中級高中 Level 5●●●vt. 指認,認定;視為同一;找出vi. 對……感同身受(與介詞 with 並用)Tammy identified the purse as hers by telling what it contained.
塔米藉著說出手提包內的東西指認這個手提包是她的。The good mayor identified the well-being of his citizens with his own.
這位善良的市長把市民的幸福當作是自己的幸福。The audience identified with the sorrow of the hero.
觀眾對這位男主角的悲痛感同身受。The team needs to identify the root cause of the system failure before it can be fixed. 該團隊須找出系統故障的根本原因,才能將其修復。
多益藍色英檢中級高中 Level 4●●●●n. & vi. 跳入vi. 驟降The lifeguard plunged / jumped into the river and saved the drowning boy.
救生員跳入河中,救起即將溺斃的男孩。Lilly decided to take the plunge and set up a design
studio of her own.
莉莉決定放手一搏,要成立自己的設計工作室。During COVID-19, Bill expected housing prices to plunge, but they stayed about the same.
新冠肺炎期間,比爾預期房價會驟跌,但房價仍維持不變。多益金色英檢中高高中 Level 5●timer[ˋtaɪmɚ]n. 定時器Practical Phrases
●economically / technically feasible經濟 / 技術上可行的
It’s not economically feasible for this grocery store to
be open 24 hours a day.
24 小時營業對這間雜貨店來說不符經濟效益。●on the whole大體上說;一般而言= in general= generally speaking= by and large= for the most partOn the whole, girls in Asia are shyer than boys.
一般而言,亞洲女孩子比男孩子害羞。●save on節省⋯⋯Sam wanted to save on his car insurance, so he switched to a different insurance provider.
山姆想節省汽車保險費,所以他換了一間保險公司。●switch off... / switch... off關上⋯⋯(電器或電子產品等)Switch off your phone from time to time, and you'll find it runs smoother after a restart.
偶爾將手機關機,然後你會發現重啟後手機跑得更順。●a line graph線狀圖I made a line graph that showed sales increases since January.
我做了一份折線圖,圖中顯示自 1 月以來的業績成長。
●air conditioning冷氣,空調●air conditioner冷氣機●energy-consuming耗能的●energy-efficient節能的延伸閱讀
關鍵字: #寫作 #永續發展 SDGs
本篇內容出自《常春藤解析/生活英語雜誌》,
2026/08/16 00:00 前買享優惠Ivy Engrest 訂戶在訂閱期間訂閱紙本(無贈品版本)再享最低 62折優惠!)>>
【雜誌訂閱】MORE&MORE
回饋與建議
為了提供更好的閱讀體驗與學習感受,有任何建議或問題歡迎留言讓我們知道,感謝~
英文問題僅回答您對本篇文章的疑慮(發現單字拼錯、文法有問題)等,其他延伸問題恕不提供回答服務。謝謝。學會了嗎?✋來答題得 熊贈點~
答
題
賺
點
數作者

Analytical Editors
透過英文閱讀,一點一滴累積核心素養~別害怕看不懂,我們都會一一解析給你知道。歡迎來信告訴我們,你還想學什麼:service@ivy.com.tw