-
首頁
-
new訂閱制數位訂閱制 Ivy Engrest 介紹 數位訂閱制 Ivy Engrest 新手攻略new數位訂閱制 優惠方案 註冊享免費體驗 7 天,再送 $200
-
看文章登入註冊難度 收藏文章
檢視這張長條圖可以清楚看到高中生通常喜歡什麼類型的電影。
>> 限量較誘人,還是打折更實在?Limited Edition or Big Discount?
圖表寫作
文章主講 Chris、Antony
提示:
下方圖表呈現的是臺灣高中生偏好的電影類型,請根據該圖寫一篇文長至少120-130 個單詞(words)的文章。文分兩段,第一段描述該圖表所呈現的內容及可能原因,第二段則敘述你自己喜愛的電影類型並說明理由。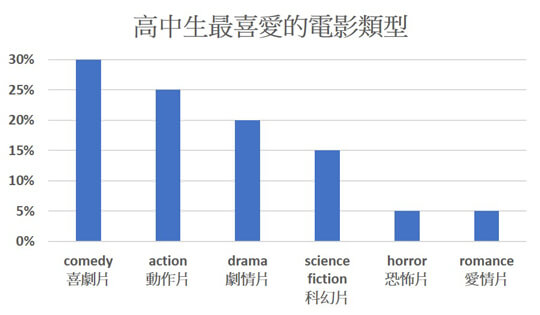
Writing Method
1. 仔細審題: 一張圖表中可能包含很多資訊,但不需全面地描述圖表,而是針對圖表內的某些內容進行重點式的描述與分析。因此,在下筆前應先仔細分析圖表所要呈現的重點,才能正確且簡要地說明該圖表的內容。
2. 重點式描述圖表: 一般而言,不需要鉅細靡遺地描述圖表上的各項數據,而是應仔細觀察圖表中數據的變化,在比較或歸納之後,找出其中最具代表性的幾項數據,並加以說明這些數據所代表的現象。
3. 與自身經驗連結: 簡述圖表所呈現的現象後,再與自身的生活經驗作連結,找出其中的相似或相異處。接著再進一步說明與圖表中相似或相異的原因為何。By examining the bar graph, one can clearly see what types of movies high school students generally prefer. In total, 55% of students favor comedies and action films over the other genres. In third place is drama at 20%, followed by science fiction at 15%, with horror and romance films both at 5%. Although the reasons for these choices are not given, I have some theories. Comedies tend to attract those who like humor. Action movies, meanwhile, appeal to our sense of adventure.
My own preference is for horror films because they always make me feel excited and anxious at the same time. These intense feelings never fail to leave me both satisfied and wanting more. Although this type of movie isn’t very popular among high school students, it simply proves that not everyone has the same tastes.
>> 與人有約 你是匆匆忙忙還是游刃有餘?Being Beaten by the Clock or Beating It
本篇內容出自《常春藤解析/生活英語雜誌》,
2026/08/16 00:00 前買享優惠Ivy Engrest 訂戶在訂閱期間訂閱紙本(無贈品版本)再享最低 62折優惠!)>>
【雜誌訂閱】MORE&MORE
回饋與建議
為了提供更好的閱讀體驗與學習感受,有任何建議或問題歡迎留言讓我們知道,感謝~
英文問題僅回答您對本篇文章的疑慮(發現單字拼錯、文法有問題)等,其他延伸問題恕不提供回答服務。謝謝。學會了嗎?✋來答題得 熊贈點~
恭喜答對獲得 熊贈點 1點
答
題
賺
點
數作者

Enjoy Editors
學英文就是要暢所欲言才夠酷▝ν▘希望讓大家學到更多英文單字、正確發音及最道地的用法,讓我們成為你在英語學習道路上的最佳戰友!歡迎來信給我們鼓勵鼓勵:service@ivy.com.tw